GroundsScrape to Dashboard
What it does for you
A coffee-place observatory with normalized records, linked filters and snapshot comparisons.
Screenshots
In more detail
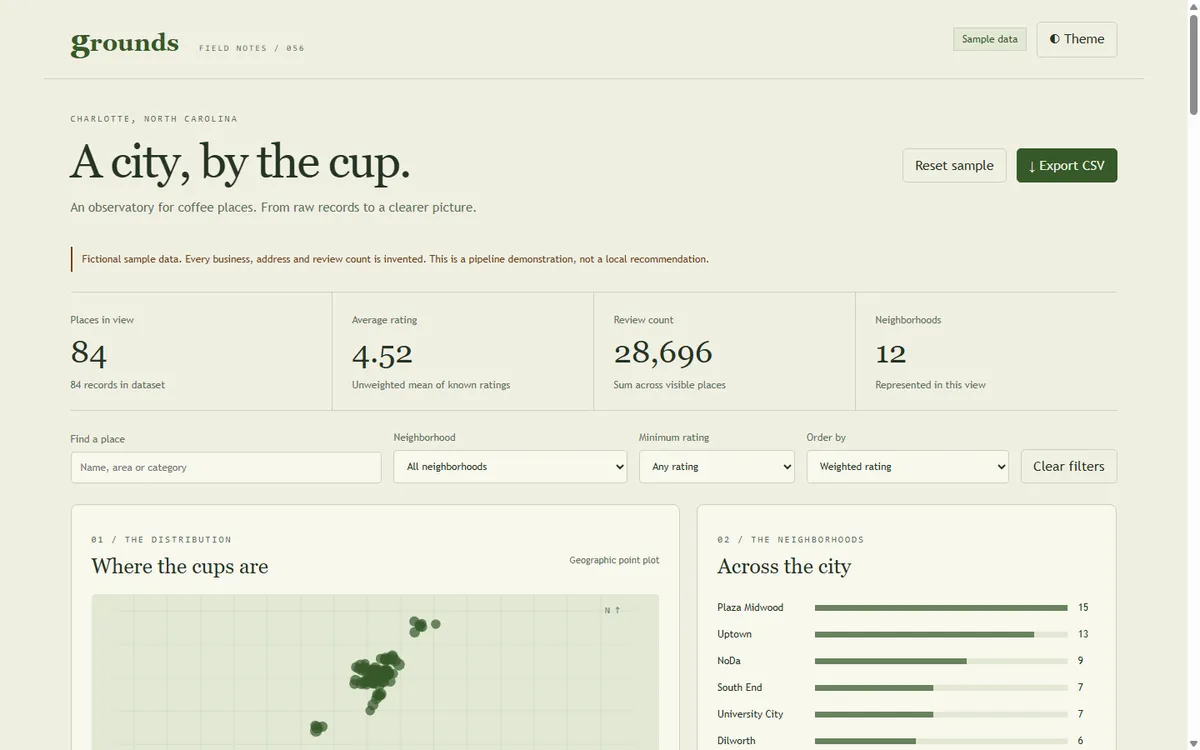
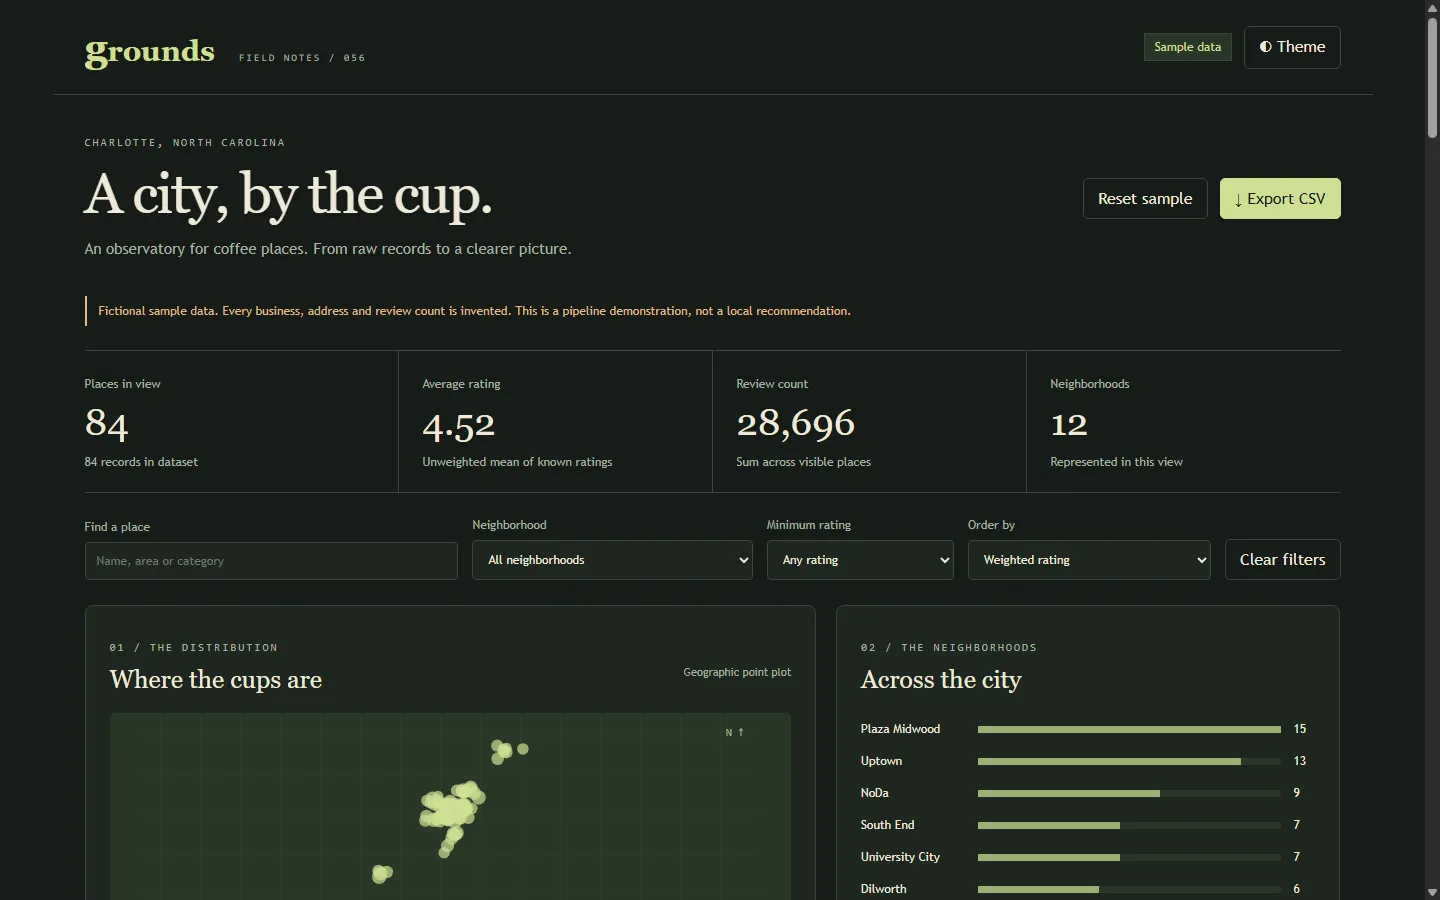
Grounds is a coffee-place observatory. It takes raw place records, the kind a scraper returns, cleans them up, and shows them as a dashboard you can filter: a point map, neighborhood bars, ratings, rankings, and a record inspector. Two snapshots of 84 fictional Charlotte places show what changed between runs: new places, missing ones, rating changes, and review growth.
Honest limits
The live Apify path was never exercised. It's fixture-tested only, with no paid calls, no scheduled collection, and no public deployment. Every place in the data is fictional. The map is a point plot with no streets. Snapshot writes aren't atomic yet.
How I built it
Grounds was a Codex row in 00-system/capstone-split.md. The folder already held a tested pipeline from an earlier interrupted session, and the split rules said to keep what passes. Codex checked the inherited 233-test core, reused it, and built the dashboard, the local server, and the browser checks on top. About 0.13 hours this session.
I set the build split, the fictional-data boundary, and the no-spend rule. Codex kept every Apify call behind explicit live configuration and used fixtures only. Like the other Codex builds, it wrote a LOG-ENTRY.json in its own folder, and Claude Code merged it after re-running the suite and doing a safety audit (Apify tokens were on the audit list).
The pipeline and the UI share the same pure functions for normalization, statistics, map projection, and snapshot diffs. Rankings use a Bayesian average that pulls places with only a few reviews toward the dataset mean, so a handful of perfect scores can't top the list on their own. Native JavaScript, SVG, Node 24, no dependencies.
What I learned
- A missing record is not a confirmed closure. The snapshot summary reports those two things separately.
- Projection math can stay testable if it isn't tied to a map library or tile network.
- A dry-run message has to describe its real source. The sample mode was printing a hypothetical remote POST, and we fixed it to say it was normalizing local data.
- Data provenance belongs next to the charts, not buried in the docs. A chart is only useful if you can see where the numbers came from.
What carried forward
The whole build is reuse: an inherited, already-tested pipeline with a new dashboard on top, following the shared house rules (tested pure module, serve.mjs on 5156, ?demo=1, dark and light themes). No later project imports Grounds' code.
If I took it further
I'd make snapshot writes atomic, let the user pick which two snapshots to compare, and validate the current Apify actor schema before spending any credit on real collections.
#056 Built with Codex September 23, 2026 233 automated checks