TaplineLive MCP Dashboard
What it does for you
Pin live MCP tool results as self-refreshing KPI tiles, tables, charts and checklists, with a guarded proxy and a sample server.
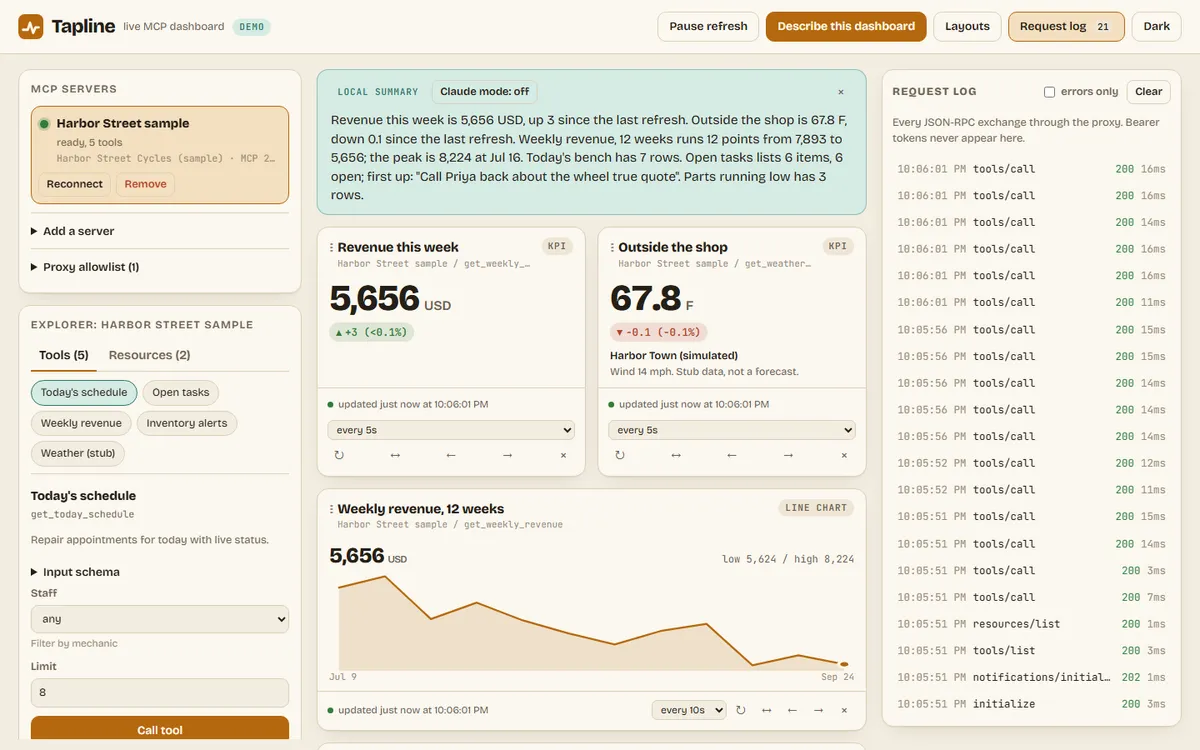
Screenshots
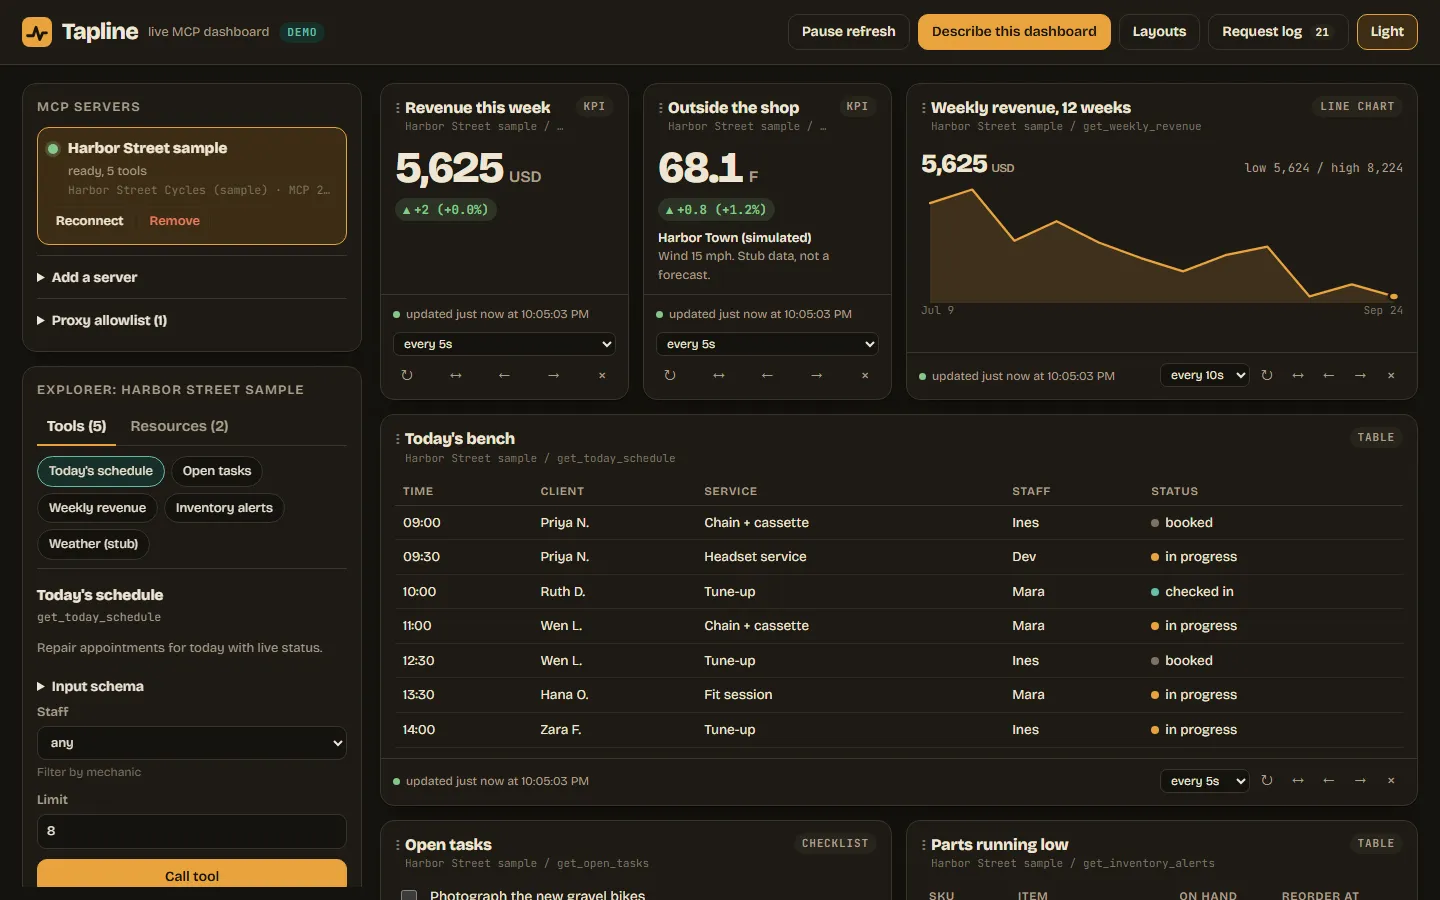
In more detail
MCP servers expose live business data as tools, but usually you see that data one chat answer at a time. Tapline connects to those servers, calls their tools, and pins the answers to a board as tiles, tables, charts, and checklists that refresh themselves. It ships with a sample server that simulates a small bike shop whose numbers drift every few seconds.
Honest limits
Only my own sample server was exercised. Servers that answer with SSE streams go through a small parser that is unit-tested but never tried against a real third-party server. The Claude "Describe this dashboard" mode was never called during the build, so the local summary is what is tested. Drag to reorder was not clicked by hand; the reorder math is tested, and the keyboard move buttons use the same code path.
How I built it
This was on the Claude Code list on the tandem day with Codex. Claude Code wrote the core modules, the servers, the UI, and seven test parts from my spec. There are three pieces: a sample MCP server (Streamable HTTP, JSON-RPC 2.0, sessions, schema-checked tools), a local proxy that forwards browser requests only to allowlisted servers, and the dashboard itself, which builds a form from each tool's input schema and picks a widget shape from the result.
The rule was: everything that can be pure is pure. The JSON-RPC layer, the handshake, the schema validator, the shape detector, the scheduler, and the security guard are small modules, and the sample server's request handler runs in tests without opening a socket.
The tests caught real bugs. A false schema was being treated as "allow anything." A cloud metadata address slipped past the guard because the URL parser rewrites ::ffff:169.254.169.254 into hex. Screenshots caught two more: every appointment showed "done," and KPI deltas never appeared.
The API connection dropped a long response once during this build. Because every file was under about 4 KB, it cost one message, not the build.
What I learned
- Headless Chrome's virtual time speeds up the page's timers but not the server's clock, so a live board looked frozen in screenshots. A small DevTools Protocol script that waits real seconds gave honest shots with real deltas.
- A drift-free scheduler is one line of math: the next run is the first grid tick after "now," anchored to when the widget was pinned. Backoff is a separate path that rejoins the grid on the first success.
- An SSRF guard has to check the name and the resolved addresses.
http://2852039166/is 169.254.169.254 after parsing, and a friendly hostname can resolve to a metadata address, so the proxy checks both and refuses redirects. - Modeling the MCP handshake as a state machine (disconnected, initializing, initialized, ready, failed) made "what am I allowed to send right now" a unit test.
What carried forward
It builds on the sprint's standard kit: pure modules tested in Node, a zero-dependency server, and the tiny-writes approach from September 20. The real-time CDP screenshot trick is the one I would reach for again. Any live UI needs real waits, not virtual time, or the screenshots lie.
If I took it further
I would add real SSE support end to end so the board can show server notifications. I would also move the allowlist into a signed config so it cannot be widened from any open tab on the same machine.
#074 Built with Claude Code September 23, 2026 311 automated checks