HeadroomFinance Forecaster
What it does for you
Compare cash-flow scenarios and trace every chart point back to a monthly ledger.
Screenshots
In more detail
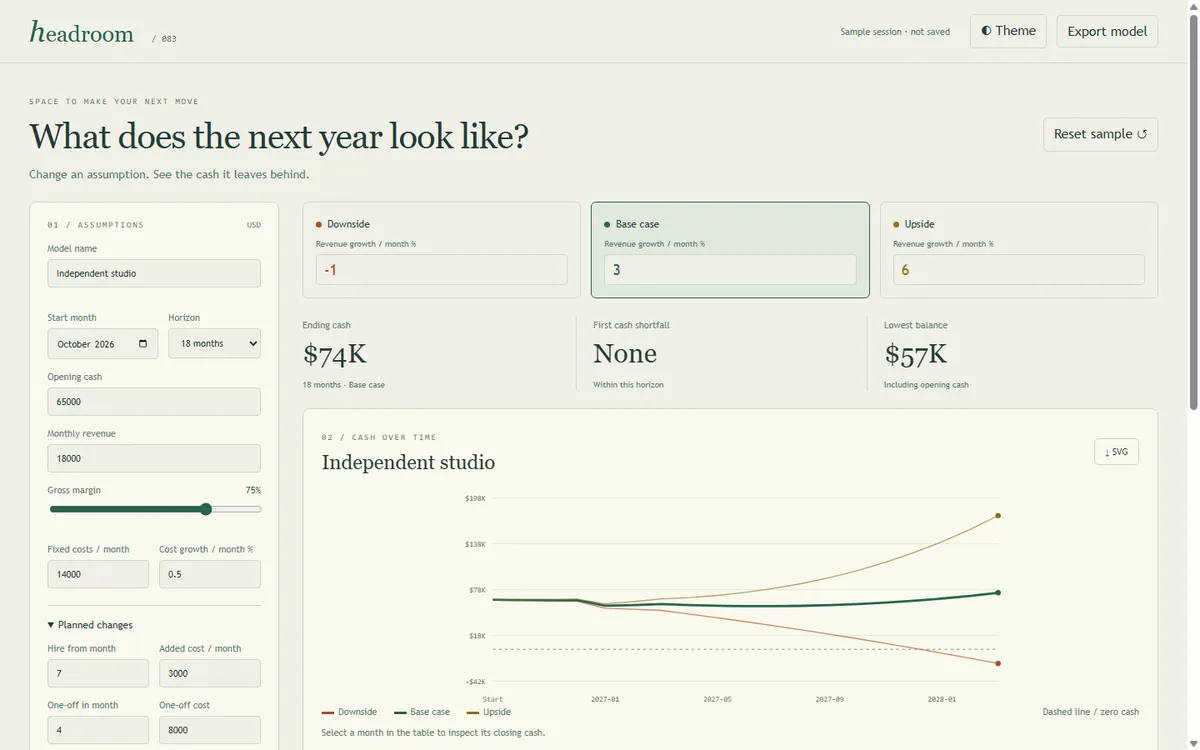
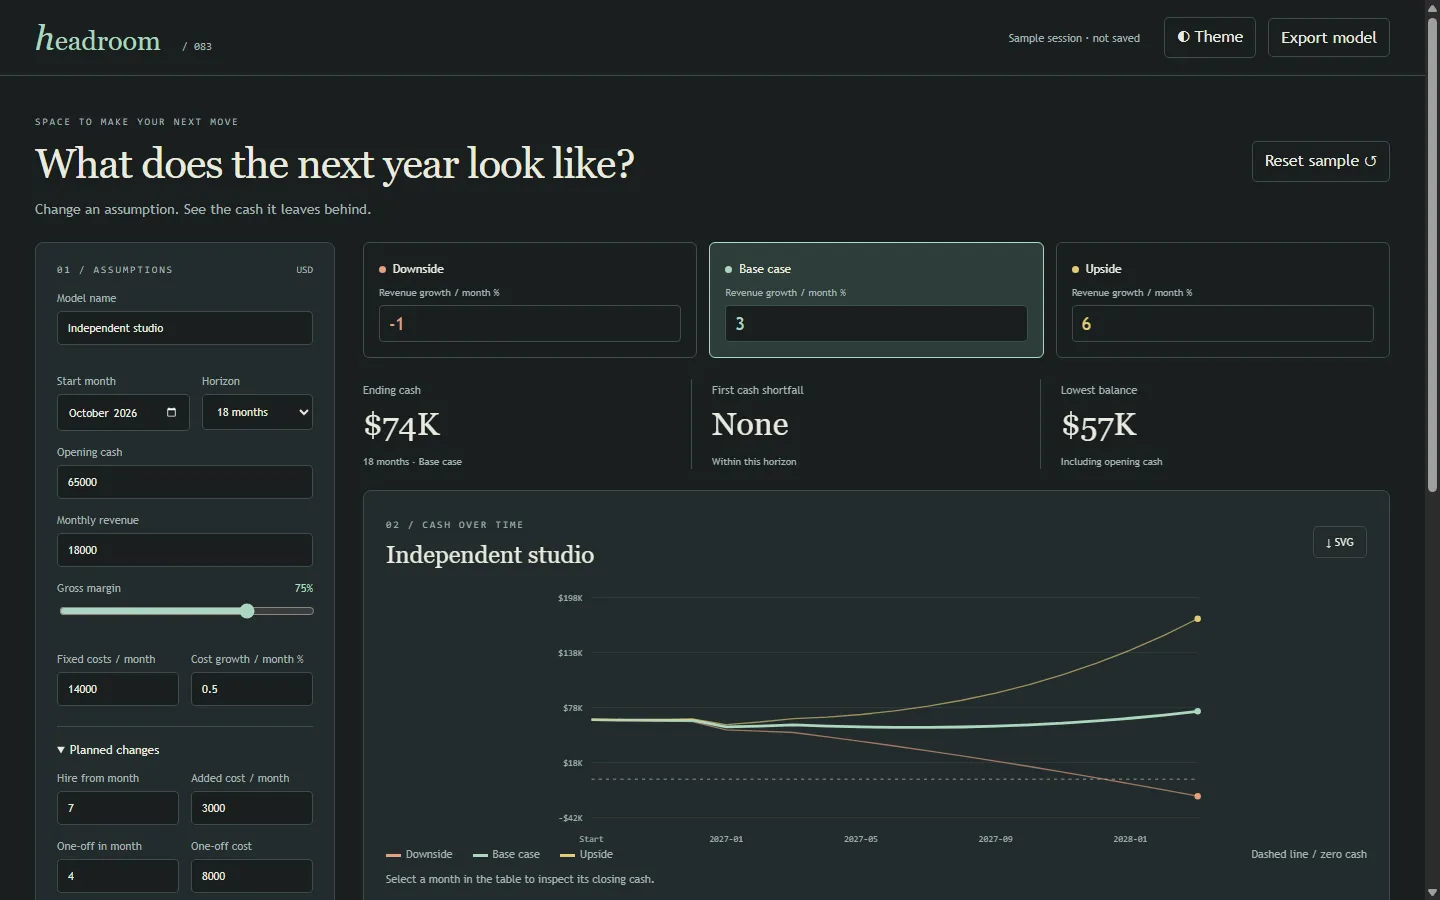
Headroom is a cash-flow workbench that puts three versions of a business side by side: downside, base, and upside. You change revenue, margin, recurring costs, expense growth, a planned hire, or a one-off expense, and you see what happens to your cash month by month. The point is to show how much a forecast depends on its assumptions, instead of hiding that behind one number.
Honest limits
No bank account or real financial data is connected. There is no probabilistic forecast, and no debt, tax, receivables, or backend. Browser checks covered selecting scenarios, changing assumptions, exact month comparisons, reset, both themes, and a 390px mobile width, and I looked at the screenshots. Two things went wrong and got fixed: the first desktop layout pushed the bottom of the chart below the first screen, and imported models with a custom horizon needed a matching option in the control. The whole build took Codex about 0.12 hours, and it reads that way: finished and tested, not hammered.
How I built it
This was one of the Codex builds. Project 83 was marked for Claude Code in the tracker, but on September 23 I brought Codex in, and the split file (00-system/capstone-split.md) gave Codex its own list with a written override of the tool guard. That file mattered. It set the house rules, and it told each builder to write a LOG-ENTRY.json in its own folder and never touch the shared tracker. Claude Code merged every entry after re-running the tests. One real snag: Codex's log files carried a UTF-8 byte-order mark that broke JSON parsing, so the merge script learned to strip it.
Codex built the pure forecast model, the validators, the scenario UI, the exports, and the browser checks. I set the scope, the design expectations, and the offline boundary. The example business is fictional. It saves locally, imports and exports JSON, and downloads CSV and standalone SVG.
What I learned
- Month one needs a stated convention. Applying growth before the first row would quietly change the starting number the user typed in.
- Cash shortfall and operating break-even answer different questions. We separated them and kept one-off costs out of the operating metric.
- Everything runs on integer cents. The chart, the metrics, and every export read the same monthly rows, so any point on the chart traces back to a row you can reconcile: inflows, costs, closing balance.
- The tests check accounting identities, not just outputs. 20 varied models get per-month invariant checks, including zero revenue and negative cash.
What carried forward
The "one ledger feeds everything" idea is the same instinct as the first-week pattern: one pure module that both the page and the tests import. The split-file protocol it was built under is what let Claude Code and Codex work in the same repo on the same day without stepping on each other. That day, 55 projects shipped.
If I took it further
I would add payment timing and seasonality before any new chart types. And I would let saved scenarios carry a note about why the assumptions changed, so the history explains itself.
#083 Built with Codex September 23, 2026 57 automated checks