GlossSheet to Narrated Report
What it does for you
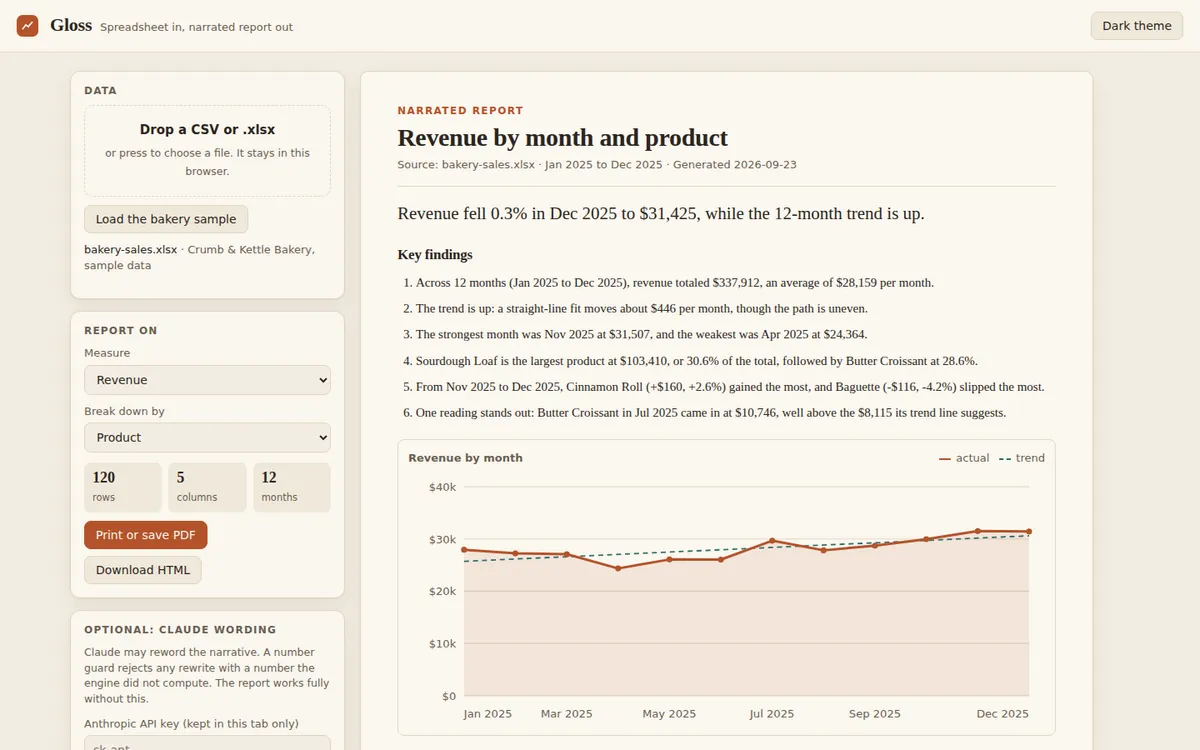
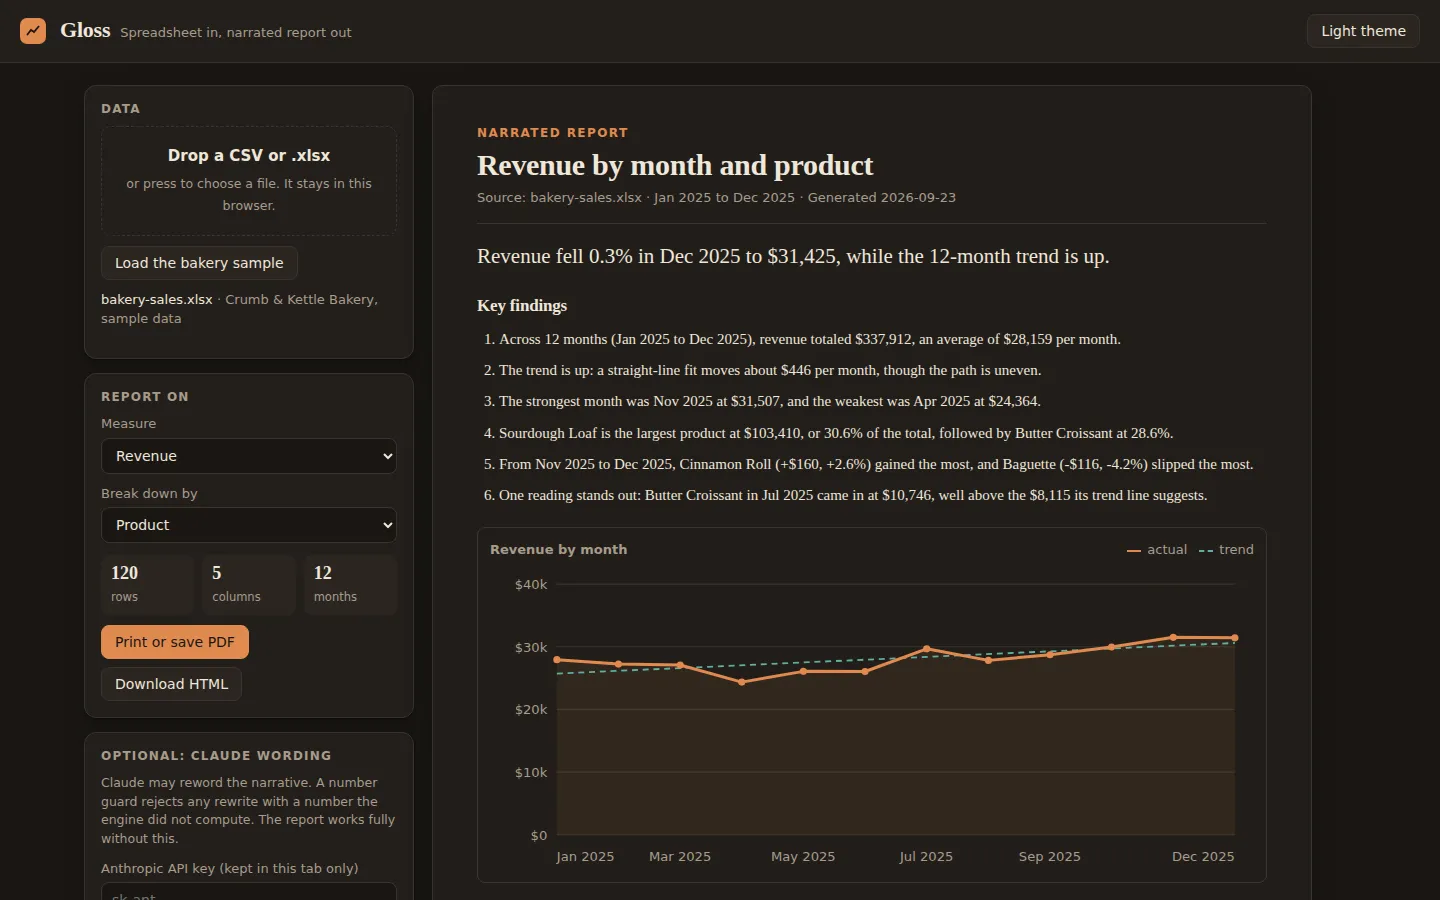
A Cowork plugin and web app that turns a CSV or .xlsx into a narrated PDF report with findings, charts, and a watch list, where every number is computed and a guard stops Claude from inventing any.
Screenshots
In more detail
Gloss reads a spreadsheet and writes a short report about it: a headline, a few plain-sentence findings, charts, and a list of things to watch. It ships as a Cowork plugin that saves the report as a PDF next to your file. Owners usually have the numbers but not the story, and asking a model to summarize a sheet is fast but risky, because it can invent or round numbers. Here the engine computes every figure and the model only touches the wording.
Honest limits
It reads the first sheet only, with one header row. The measure is the first revenue-like column, and anomalies need at least 6 periods. The bakery data is synthetic, with a planted spike. Seasonal businesses may still see false "unusual" flags. The Claude rewrite was not called live during the build.
How I built it
Same September 23 Cowork batch as #81. I gave the spec: an XLSX reader with a tiny inflate adapter, profiling, trend and anomaly math, a narrated report with charts and a PDF, an optional Claude rewrite behind a number guard, and a Cowork plugin with a verified .plugin zip. Claude Cowork built it in one pass: engine first, then verify.mjs, then the page, the command line tool, the plugin skill and slash command, and the packaging script.
To be honest, setting up a Cowork plugin felt faster to me than setting up a Claude Code build. The whole thing is one core file, report-core.js, imported by the page, the CLI, the plugin (as a byte-identical copy), and all 340 assertions. The zip and XLSX readers are hand-written. No npm.
The number guard is the part I would point at. It normalizes every number in the computed narrative and rejects any rewrite that introduces a number that was not there. The model can change words, not facts.
What I learned
- A z-score built on the median absolute deviation still gets diluted by seasonality. A planted 1.85x croissant spike scored 3.1 against a 3.5 threshold. The detector was right to be careful, so I kept the threshold and made the fixture's spike clearer. It now scores about 14.
- With a 6-finding cap, the order findings get generated in is a ranking decision. The anomaly was detected but never shown, because the location split filled the last slot. Moving it ahead of the secondary breakdown fixed that.
- XLSX rows are sparse. A blank trailing cell is just absent, so rows come back short. Padding every row to the header width in one place kept CSV and XLSX identical, and a test that expects the same narrative from both caught it.
- Pinning the zip's DOS timestamp made the
.xlsxfixture and the.pluginfile byte-stable, so verify compares them byte for byte against a fresh build.
What carried forward
It uses the shared-core pattern from the first week, pushed further: one module serving four consumers. The Playwright PDF approach matches #81 from the same batch. Keeping the model on words only, with code owning the facts, is the same idea that shows up in #87, #88, and #90.
If I took it further
I would let you pick the sheet in a multi-sheet workbook and handle a title row above the table, since real exports often have one. With 24 or more periods I would compare against the same month last year.
#084 Built with Claude Cowork September 23, 2026 340 automated checks