Common GroundGeo Data Story
What it does for you
A scroll-driven places story with linked map layers, grid counts and explicit source limits.
Screenshots
In more detail
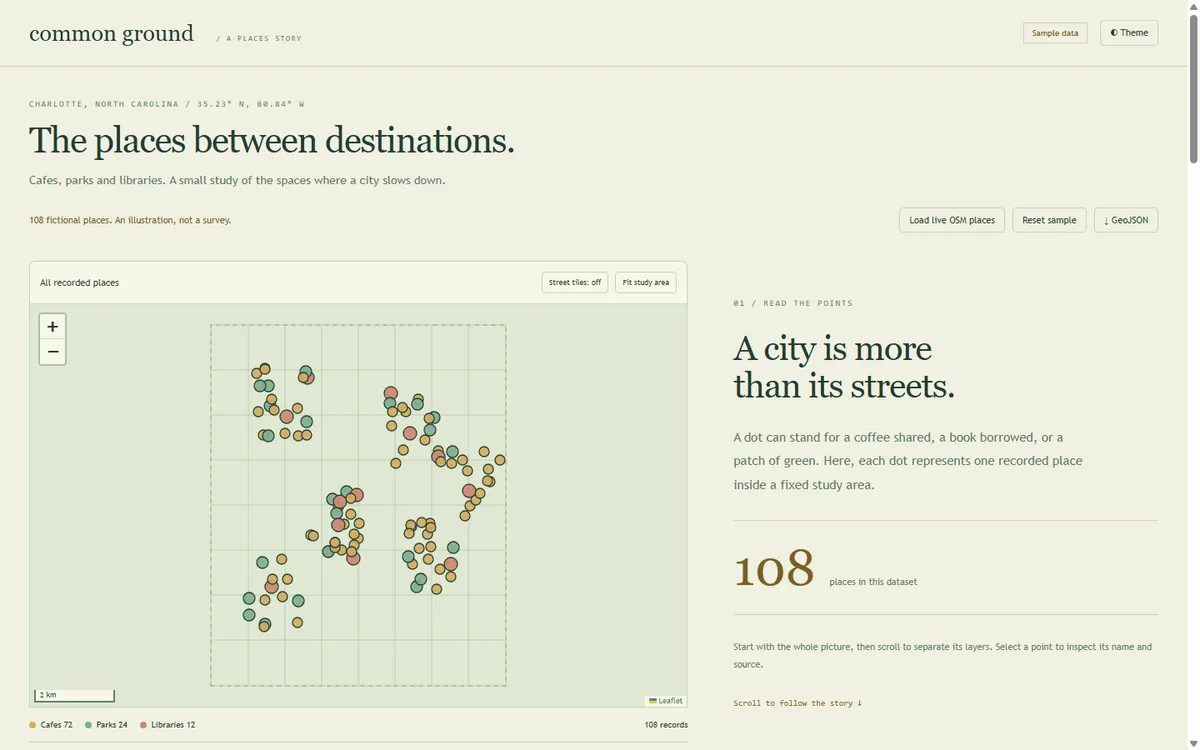
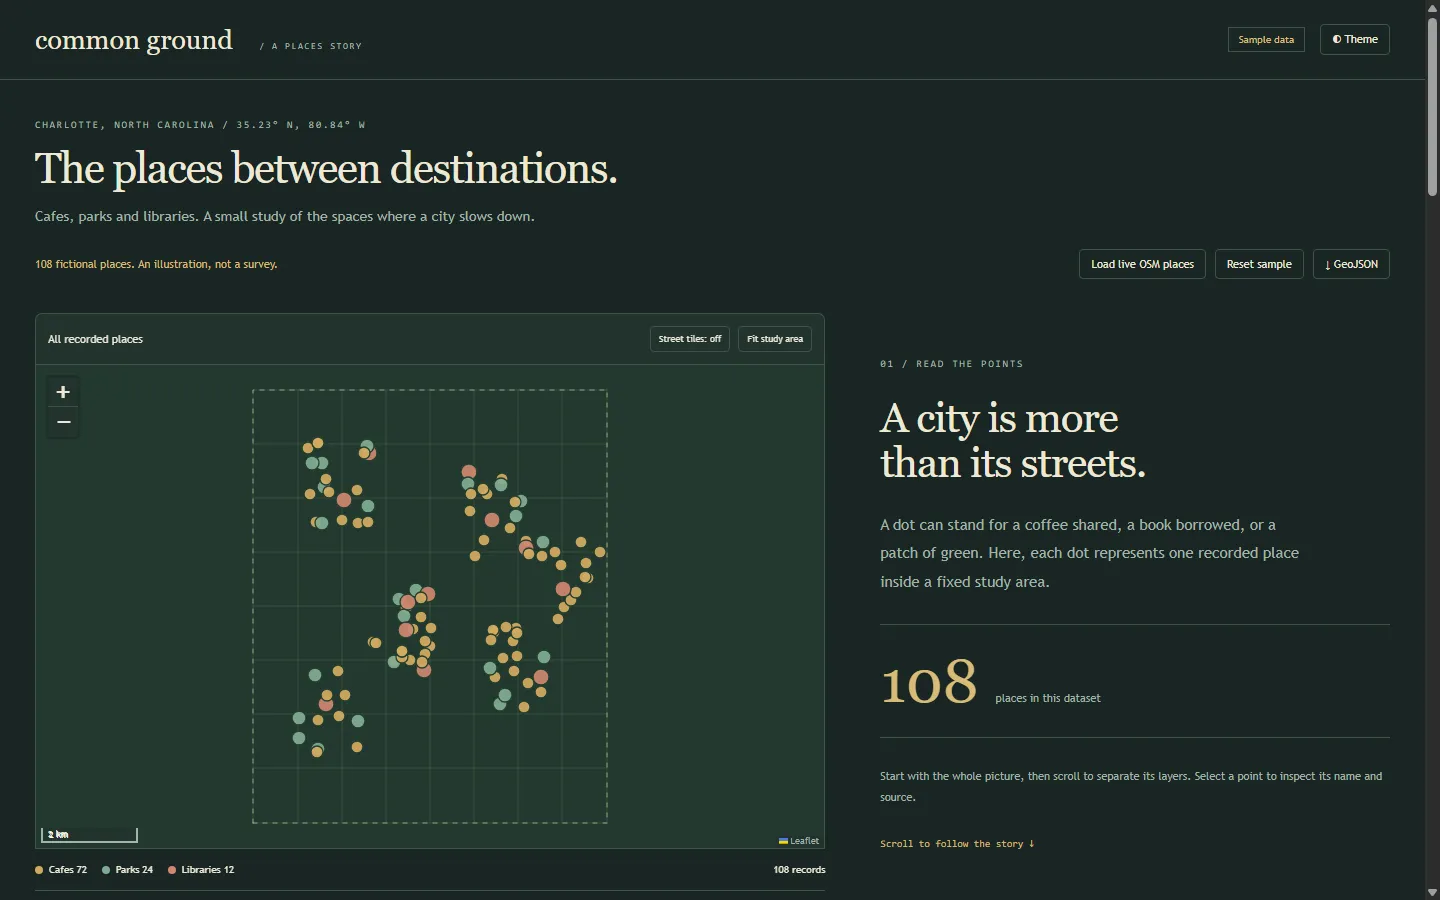
Common Ground is a scroll-driven map story. As you scroll through five chapters, a map of places in a Charlotte study area shifts from everything, to cafes, to libraries, to an 8 by 8 grid of counts. The last chapter is about what the map cannot tell you: an empty patch is a question about the data, not proof that nothing is there.
Honest limits
34 core checks passed, and Chrome checks covered all 108 markers, safe popup content, the library filter, all 64 grid cells, chapter navigation, both themes, and mobile overflow. But no live Overpass or tile request was made during verification. That path is fixture-tested only, and public services can throttle or go down. Grid cells are not neighborhoods, and counts are not access or walkability scores. Duplicate venues with different map ids are not merged.
How I built it
Codex built this one on September 23, working from its list in the split file. It wrote the sample data generator, a normalizer for live data, the map and story interface, the grid math, and the checks. I supplied the spatial scope and the evidence rules. Codex labeled the fictional data clearly and kept every live service optional and uncalled during tests.
The offline example has 108 fictional places. Leaflet 1.9.4 is bundled locally with its license, so the whole story runs with no network. If you want, one button pulls live cafes, libraries, and parks from OpenStreetMap through a bounded Overpass request. It caches results for six hours, waits at least 30 seconds between uncached requests, and keeps the current data if a request fails. Street tiles are off by default.
What I learned
- A missing record is not proof that a place does not exist. We made that uncertainty part of the final chapter instead of a footnote.
- Using the center of a park or building makes it countable on a grid, but it says nothing about how much ground it covers. The interface says so.
- A bounds test caught sample points escaping the study area. One cluster could land just outside the eastern edge, so Codex tightened the generator until every record sat inside the same comparison frame.
- Every view reads one normalized set of points, and the grid tests prove no boundary point gets silently dropped. Whole zoom levels also left too much empty map, so it switched to fractional zoom fitting.
What carried forward
It follows the shared build rules from the split file: its own serve.mjs on port 5185, ?demo=1 and ?theme= for repeatable screenshots, both themes, and a LOG-ENTRY.json that Claude Code checked before merging. The "one data source feeds every view" habit is the same one behind #83's single cash ledger. Spatial work stays in the consumer and creative lane here: places and a story, nothing more.
If I took it further
I would add reviewed snapshots of the source data and smarter duplicate matching before using this for a real neighborhood comparison. Anything about access would need population data and more evidence than a count map.
#085 Built with Codex September 23, 2026 34 automated checks